

Early in my education data career, I found myself looking at the desktop of a district psychometrician. I’ll call him Dr. Ron.
If psychometrician isn’t a title you run across every day, think of someone who specializes in educational measurement: assessments, results, and what we can reasonably conclude from the scores. Dr. Ron knew a great deal more about all of that than I did.
What stopped me in my tracks was how much of his day went into managing the data before he could study what it meant.
He had a 21-inch monitor, which was a pretty serious piece of real estate at the time. The desktop was covered with icons. Around 125 of them. Each represented a Microsoft Access database, one for each school.
It was a filing cabinet with a screensaver.
Assessment files came in from the schools. Dr. Ron maintained a database for each school and brought them together into a district database. Every delivery meant another round of making things line up.
I don’t remember the computer actually smoking when he loaded the last of those hundred-plus databases. But that’s how I picture it now: Dr. Ron clicking the final button, the hard drive begging for mercy, and a thin curl of smoke rising from behind the monitor.
I asked how much of his time went into preparing, checking, and moving data rather than analyzing it. His estimate, as I remember it, was somewhere between 80 and 90 percent.
Think about that. A specialist trained to interpret educational evidence was spending most of his time getting it into shape.
Dr. Ron had the data. He also carried much of the knowledge required to make it useful. And while he was squeezing the lemons, somebody was waiting for an answer.
Lemons, not lemonade
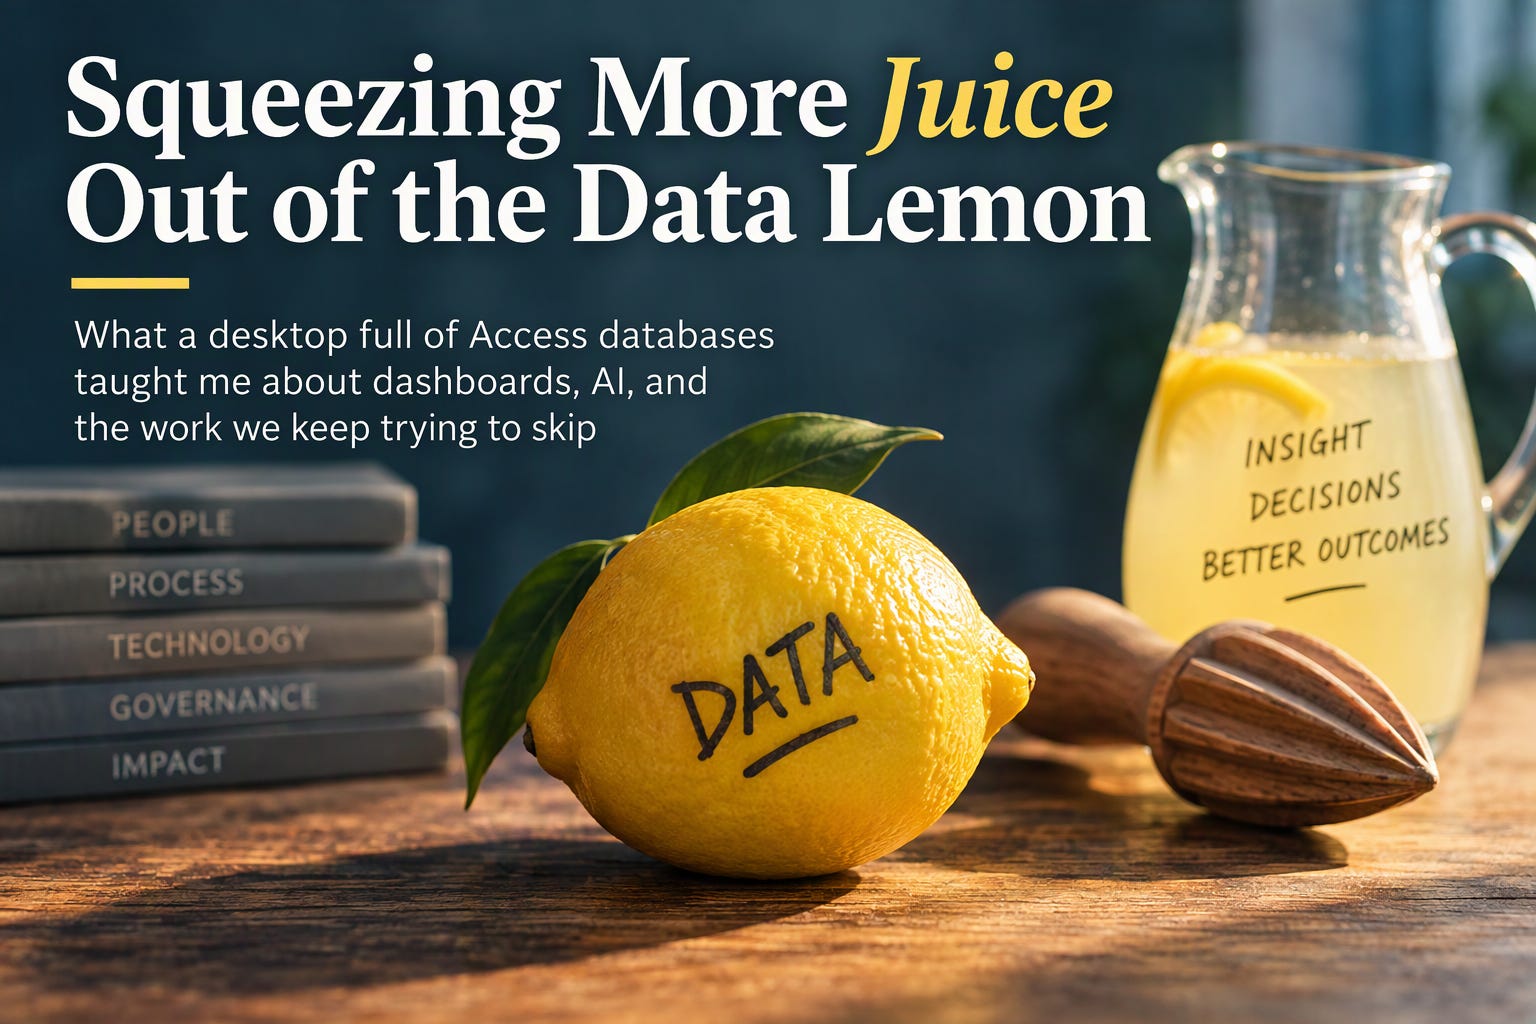
I’ve come to think of data as a lemon. There is something worthwhile inside, but first you have to deal with the peel, the seeds, and everything else that keeps it from being useful.
In education, those obstacles have familiar names: separate systems, inconsistent definitions, awkward formats, different levels of detail, and tools requiring specialized skills.
Nobody asked for a better inventory of lemons. They wanted lemonade.
The part we keep forgetting is the squeeze.
Over the years, we have built increasingly sophisticated ways to manage that squeeze. Each generation solved a real problem. But having the lemons isn’t value, and extracting the juice isn’t quite value either.
The value appears when someone can consume the information, understand it, trust it, and use it.
The eras that follow aren’t clean technology boundaries, and one never completely replaced the one before it. Think of the dates as mile markers from my own experience.
When I entered education technology around 2000, my impression was that much of what I encountered was roughly eight years behind the corporate technology environments I knew. That’s my recollection, not a benchmark. Over the years, I’ve watched that gap narrow considerably. Today, my sense is that it’s often closer to a couple of years, with plenty of exceptions in both directions.
And you can still walk into one organization and find pieces of all four eras operating at the same time.
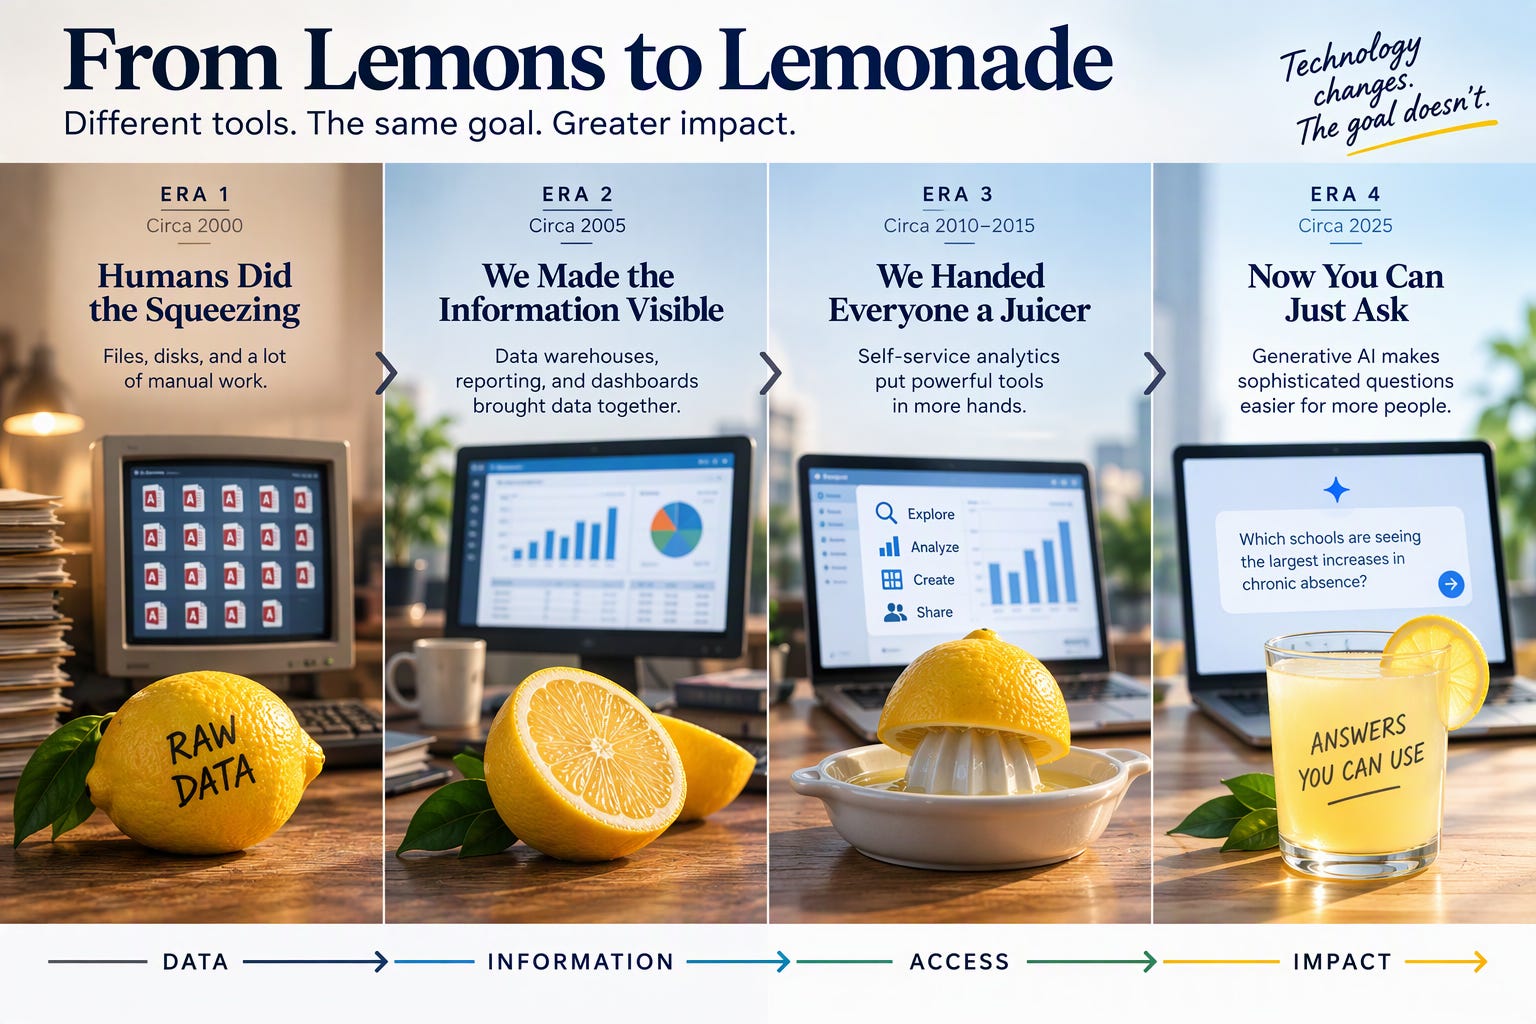
Era one: Humans did the squeezing | Circa 2000
Sitting at a desktop didn’t necessarily mean you could reach into a back-office or enterprise system and get the information you needed. Data often arrived as a file. Sometimes it arrived on a disk. Somebody carried it from one computer to another.
We called it “sneakernet”, which sounded considerably more sophisticated than walking down the hall with a disk in your hand.
For many of us, Excel or Lotus 1-2-3 was where the work happened. If you had Access, you had a local database with considerably more room, so you loaded it up with as much data as it would reasonably hold. Then you joined, sorted, checked, summarized, exported, and probably moved another file somewhere else.
It was less a data pipeline than a data bucket brigade.
Every handoff mattered. Which file was current? Had somebody changed it? Did the columns still mean what you thought they meant? Was this the final version or the final-final version?
That’s what made people like Dr. Ron so important. The systems contained the data. People carried much of the knowledge required to make the pieces work together.
Too much of that expertise was consumed getting information ready before it could be applied to understanding what the information meant.
So we did what technology people have always done when faced with a difficult problem.
We created a better juicer.
Era two: We made the information visible | Circa 2005
By the middle of the decade, the environment I was working in was changing quickly. States and districts were investing more heavily in data warehouses, consolidated reporting, business intelligence tools, and increasingly sophisticated dashboards.
That was real progress. Technology teams could bring information together more systematically. Reports became easier to produce. We were moving away from the idea that every important answer had to begin with somebody finding the right file on the right computer.
We produced a lot more juice.
And if one dashboard was useful, well, there was certainly no shortage of enthusiasm for building another one.
The limitation was subtler. Making information visible wasn’t necessarily the same as making it actionable.
A 2024 overview of research on learning analytics dashboards found, among other themes, that dashboard-generated predictions were not clearly translating into pedagogical actions.
In a 2019 national poll, the Data Quality Campaign found that 86 percent of teachers said using data was important to being an effective teacher, while 81 percent said they dipped into personal time to apply student data to lesson plans and teaching practices.
The demand for useful information was there. Some of the squeeze was still landing on the people trying to use it.
Then I saw a different version of the problem while working with a state.
We examined dashboards used by different audiences and found the same metric calculated three different ways.
Each result had a logic somebody could defend.
That was precisely the trouble.
Three groups thought they were looking at the same thing. They weren’t. The state didn’t have an operational way to settle the definition, distinguish measures that were intentionally different, and make systems consistently follow those decisions.
Three dashboards had become three versions of the truth.
We hadn’t exactly lost the truth. We just had three perfectly reasonable places to look for it.
Attendance makes the problem tangible. The U.S. Department of Education defines chronic absenteeism as missing 10 percent or more of school. A 2026 Southern Regional Education Board review found that 37 states had definitions of chronic absenteeism, most using a threshold of 10 percent or greater, while states also use related approaches for early warning, truancy, intervention, accountability, and support.
Similar-looking measures can legitimately answer different questions.
Different answers aren’t automatically wrong. Unexplained differences are the problem.
For a superintendent explaining a number to a board or community, “we’re not sure why the dashboards disagree” isn’t much of an answer.
A data problem has become a credibility problem.
Era three: We handed everyone a juicer | Circa 2010-2015
Then came self-service analytics.
I believed strongly in the idea. And to be fair to my younger self, it was a pretty good idea.
Give program leaders direct access to data. Give them intuitive tools. Let them explore questions without waiting for an analyst to write another query or build another report.
Sometimes self-service removed the bottleneck. Sometimes it transferred more of the squeeze to the person asking the question.
A principal shouldn’t have to understand the underlying data model to identify students who may need attention. A program director shouldn’t have to become a reporting expert to determine whether an intervention is working.
And a superintendent probably doesn’t want a better query interface. They want an answer they can understand and defend, preferably before the meeting starts.
Sometimes we handed someone a juicer when what they really wanted was a glass.
Era four: Now you can just ask | Circa 2025
Generative AI changes the interface again.
AI creates the possibility of making sophisticated questions easier for far more people to ask. Instead of learning the structure of a reporting system, a leader may increasingly be able to start with the question.
A superintendent might ask: Which schools are seeing the largest increases in chronic absence?
A program leader might ask: Where is this intervention working, and where are we not seeing the results we expected?
A CIO might ask: Where did this answer come from, and how current is the information behind it?
That’s meaningful progress.
CoSN’s U.S. State of EdTech 2026, based on 607 survey responses from education technology leaders, reported that 79 percent of responding districts had AI guidelines in place, compared with 57 percent in 2025. It also reported that 96 percent of responding technology leaders saw potential for AI to positively affect education.
We’re clearly thinking about rules for using AI. There’s another question that deserves equal attention:
What information are we letting AI use to produce the answer?
Put AI on top of three calculations of the same metric and the disagreement underneath doesn’t magically disappear. It may become harder to notice.
A dashboard at least showed you a number you could argue with.
AI can now explain conflicting answers beautifully.
And accuracy isn’t the only issue. When an answer matters, we need to know where it came from. An answer can also be accurate and still contain information the person asking shouldn’t receive.
Making questions easier doesn’t make meaning, accountability, privacy, or trust automatic.
AI doesn’t eliminate the work underneath education data. It changes where that work needs to happen.
The recipe was never glamorous
Across every one of these eras, some of the least glamorous work has remained remarkably similar.
What does this measure mean? What counts? Which dates apply? Where did the information come from? Who owns the definition? How current is it? Where is that definition actually being used? What happens when the numbers don’t agree?
None of that is likely to be the most exciting slide in the presentation.
It may be the slide that determines whether the other slides are right.
In plain language, that’s data governance.
In the lemon analogy, it’s the recipe.
Writing down the recipe isn’t enough. You can have a beautifully documented recipe and still end up with three different pitchers. The systems producing the answers have to follow it.
The goal isn’t one number for every purpose. It’s making the differences deliberate, documented, and explainable.
AI makes this more important because the interface can make getting an answer feel deceptively simple.
The sophistication moves out of sight.
The responsibility doesn’t.
A word for the skeptics
None of this means dashboards are obsolete. They aren’t. It doesn’t mean everybody wants to talk to their data. They don’t. And imperfect data can still be useful.
Governance can’t become an excuse for spending years defining everything before anyone is allowed to learn anything.
Use the lemons you have. Learn from the juice.
Just don’t tell everybody it’s lemonade until you know what’s in the glass.
Sometimes different answers are appropriate. Sometimes information is incomplete. And sometimes the most trustworthy answer an AI system can give is:
I can't answer that reliably from the information I have.That’s not failure.
A confident explanation nobody can defend is worse.
Back to Dr. Ron
I still think about that desktop full of Access databases.
The wrong lesson is that technology should have replaced Dr. Ron. His expertise was the most valuable part of the process.
The waste was requiring so much of that expertise to be spent moving, checking, reconciling, and rebuilding the same things before he could use what he knew.
That’s still the opportunity.
Technology should reduce the work that doesn’t require Dr. Ron so he can spend more time on the work that does: interpreting evidence, recognizing anomalies, testing assumptions, explaining uncertainty, finding patterns, and helping someone decide what to do next.
We’ve come a long way from “sneakernet” and a desktop full of Access databases. The technology gap I thought I saw when I entered education has narrowed considerably.
But the goal hasn’t really changed.
The goal is information people can consume, understand, trust, trace to its source, appropriately receive, and use while there is still time to act.
That’s the lemonade.
So here’s the question I’d leave with you:
If three people in your agency asked the same attendance question tomorrow, would they get an answer they could explain and defend? Or would your best analyst spend the day untangling three versions of it?
Visit my website
Sources and further reading
Southern Regional Education Board: Chronic Absenteeism and State Policy, 2026 Overview. [sreb.org]
Data Quality Campaign: Teachers Want to Use Data But Can’t Go It Alone, 2019. [dataqualit...mpaign.org], [dataqualit...mpaign.org]
A Current Overview of the Use of Learning Analytics Dashboards, Education Sciences, 2024. [mdpi.com]